Check out my first novel, midnight's simulacra!
Kprobes

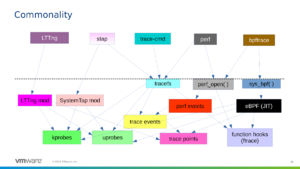
Kprobes use the breakpoint mechanism to dynamically instrument Linux kernel code. Two types exist: kprobes can be attached to all but a few blacklisted instruction ranges in a running kernel, while kretprobes are attached to a function and run when it returns. This instrumentation can be packaged as a kernel module (using the register_probe and unregister_probe kernel API, as done by SystemTap), manipulated via debugfs (as done by ftrace), configured using the perf tool, or implemented as a BPF_PROG_TYPE_KPROBE-type eBPF program.
uprobes are the userspace equivalent of kprobes. jprobes are no longer a thing. i don't believe dprobes to be a thing anymore, either, but might be mistaken. tracepoints are places to hook the same kind of analysis, explicitly specified by kernel authors using TRACE_EVENT; think of them as "opt-in", as opposed to dynamic kprobes, though there is a tracepoint for each system call.
Kernel configuration
CONFIG_KPROBES=y
CONFIG_KPROBES_ON_FTRACE=y
CONFIG_HAVE_KPROBES=y
CONFIG_HAVE_KPROBES_ON_FTRACE=y
CONFIG_KPROBE_EVENTS=y
Working with kprobes
To add, trace, and destroy a kprobe, use the kprobe binary (sometimes known as kprobe-perf) from the perf toolkit.
The primary means for working with longterm kprobes from userspace is debugfs (typically mounted at /sys/kernel/debug) and the perf tool. Note that /sys/kernel/debug/tracing/events/kprobes will not appear until you have enabled at least one kprobe.
| Task | sysfs | perf |
|---|---|---|
| List functions suitable for probing | read debug/tracing/available_filter_functions | perf probe -F (note: in my experience, this always lacks a few available from the sysfs list. i'm unsure why.) |
| List registered kprobes | read debug/kprobes/list | ? |
| List probe events | read debug/tracing/kprobe_events | perf probe -l |
| Add kprobe | write def to debug/tracing/kprobe_events | perf probe -a def |
| Remove kprobe | write -:NAME to debug/tracing/kprobe_events | perf probe -d |
| Enable kprobe | write debug/tracing/events/kprobes/NAME/enable | ? |
| Trace kprobe | read debug/tracing/trace_pipe | perf trace -e kprobes:NAME |
Kprobe definition
Taken from the 5.3.4 kernel source at Documentation/trace/kprobetrace.txt:
  p[:[GRP/]EVENT] [MOD:]SYM[+offs]|MEMADDR [FETCHARGS]  : Set a probe
  r[MAXACTIVE][:[GRP/]EVENT] [MOD:]SYM[+0] [FETCHARGS]  : Set a return probe
  -:[GRP/]EVENT                     : Clear a probe

 GRP        : Group name. If omitted, use "kprobes" for it.
 EVENT      : Event name. If omitted, the event name is generated
          based on SYM+offs or MEMADDR.
 MOD        : Module name which has given SYM.
 SYM[+offs] : Symbol+offset where the probe is inserted.
 MEMADDR    : Address where the probe is inserted.
 MAXACTIVE  : Maximum number of instances of the specified function that
          can be probed simultaneously, or 0 for the default value
          as defined in Documentation/kprobes.txt section 1.3.1.

 FETCHARGS  : Arguments. Each probe can have up to 128 args.
  %REG      : Fetch register REG
  @ADDR     : Fetch memory at ADDR (ADDR should be in kernel)
  @SYM[+|-offs] : Fetch memory at SYM +|- offs (SYM should be a data symbol)
  $stackN   : Fetch Nth entry of stack (N >= 0)
  $stack    : Fetch stack address.
  $argN     : Fetch the Nth function argument. (N >= 1) (\*1)
  $retval   : Fetch return value.(\*2)
  $comm     : Fetch current task comm.
  +|-[u]OFFS(FETCHARG) : Fetch memory at FETCHARG +|- OFFS address.(\*3)(\*4)
  NAME=FETCHARG : Set NAME as the argument name of FETCHARG.
  FETCHARG:TYPE : Set TYPE as the type of FETCHARG. Currently, basic types
          (u8/u16/u32/u64/s8/s16/s32/s64), hexadecimal types
          (x8/x16/x32/x64), "string", "ustring" and bitfield
          are supported.

  (\*1) only for the probe on function entry (offs == 0).
  (\*2) only for return probe.
  (\*3) this is useful for fetching a field of data structures.
  (\*4) "u" means user-space dereference. See :ref:`user_mem_access`.
Further reading
- LWN's Introduction to Kprobes, 2005-04-18