Check out my first novel, midnight's simulacra!
Visualization
My current home metrics + visualization stack is self-hosted Grafana OSS atop a Prometheus time series database. Prometheus is fed by mqtt2prometheus, which reads Mosquitto-brokered metrics from my bespoke scripts and various IoT devices. Grafana also ingests SNMP from my switches via its own snmp_exporter. I was originally using Prometheus's node_exporter, but thought it horribly heavyweight and kicked that bitch to the curb.
At Microsoft, I use Grafana atop an otherwise custom stack. At Google, I used an entirely custom stack because hey, SWEs gotta get promoted, and the authors of Monarch weren't gonna demonstrate complexity by adapting standard open source tooling.
Data sources
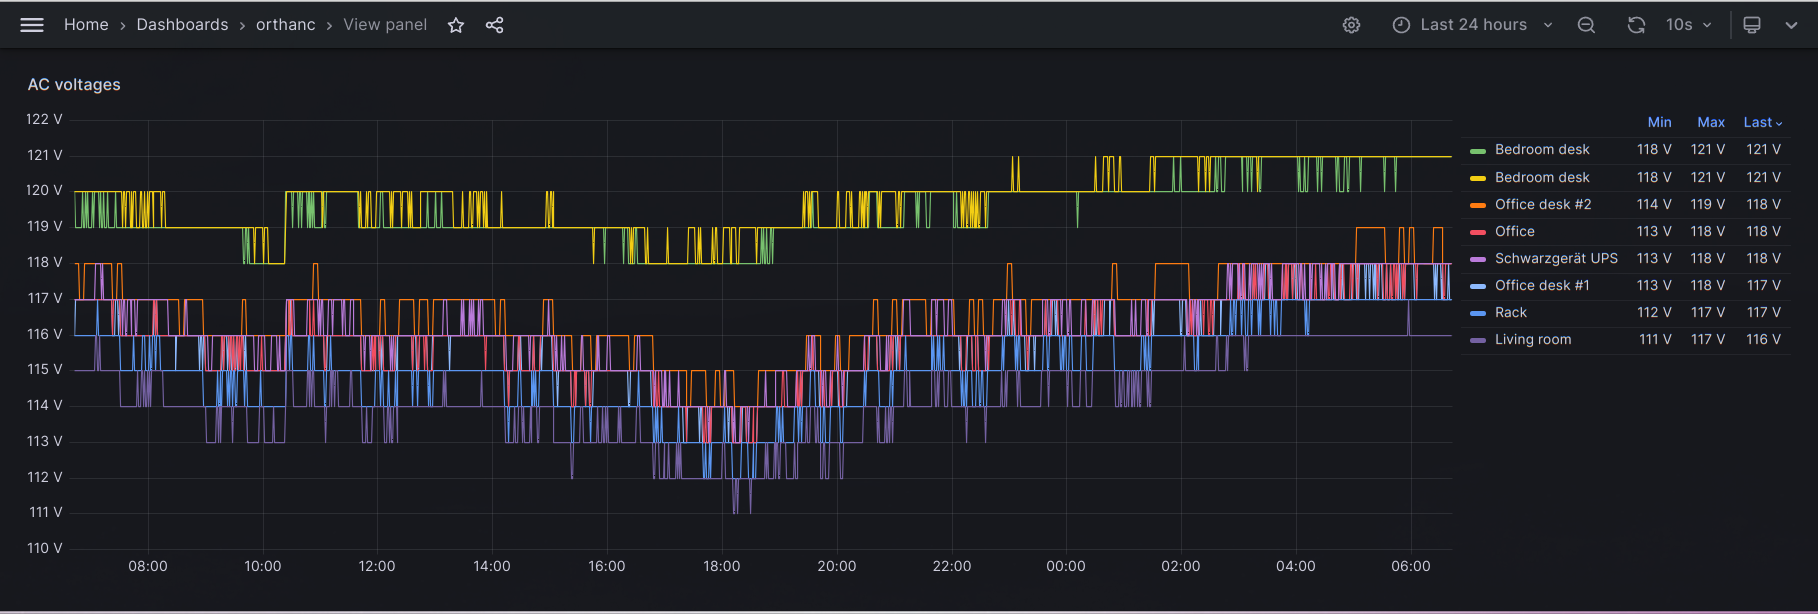
I've got an ESP8266-powered Sonoff S31 smart plug on pretty much every outlet plate. They can be found for less than $20 on sale and consume negligible parasitic power. The vendor firmware is cursed, and ought be immediately replaced with open source Tasmota (this takes about ten minutes per device). Once this is done, enable MQTT. From these, I sample wattage, AC voltage, and wireless quality.
On each machine, I run a script (from systemd, of course) that periodically samples a bunch of crap, marshals it into JSON with jq, and then sends it off as a unit with mosquitto_pub. Try to get everything for a single machine into a single block so as not to make more than one TLS connection per sampling period (note that this means all metrics will arrive under one topic, which might not jive with your schema). I run with a 15s quantua across all my devices. I recommend being liberal but loud in the face of sampling errors; ideally, errors in sampling will themselves be graphed, and brought to your immediate attention without breaking the device's reporting entirely.
For different machines, supply a different --id to mosquitto_pub. This will allow you to differentiate them via the sensor label in Grafana.
Prometheus
By default, your databases will be in /var/lib/prometheus. The initial retention size and time, at least on Debian, are ridiculously small. Edit /etc/default/prometheus and add something like --storage.tsdb.retention.size=10GB --storage.tsdb.retention.time=10y to ARGS. I don't know whether Prometheus gets slow when it hits these sizes/ages, but I do know it sucks to go look at your data and find out you're only retaining two months' worth. I currently (2023-06) have ~600MB across six months, and have seen no issues.
By default, Prometheus provides a data explorer UI and API on port 9090. Exporters (e.g. snmp_exporter) usually run their own UIs/APIs on their own ports (e.g. 9116 for snmp_exporter).
mqtt2prometheus
SNMP
Debian's prometheus-snmp-exporter package provides prometheus-snmp-generator and the prometheus-snmp-exporter server. The former is used to build /etc/prometheus/snmp.yml. The package cannot Depend on snmp-mibs-downloader due to this package being in non-free, but you'll want it for the download-mibs script.
Grafana
Grafana strongly encourages you to run their "Enterprise Edition", so naturally I chose otherwise. The "OSS Edition" can be downloaded here. I don't really know anything about the difference between the two, and simply trust "OSS" more than I do "Enterprise". Unlike Prometheus, Grafana does not appear to be naturally available in Debian, but I've run into no problems with their deb on Unstable.
